How to calculate concentration from absorbance? - (absorbance to concentration)
Beer Lambert’s law holds a special significance in chemistry. It is a linear relationship formula that can be used to calculate the molar concentration of a UV-visible light-absorbing chemical compound.
In this article, we will teach you how to find concentration from absorbance with some solved examples.
But before that, let us introduce you first to what is Beer Lambert’s law and all the mandatory perquisites. So come along and continue reading!
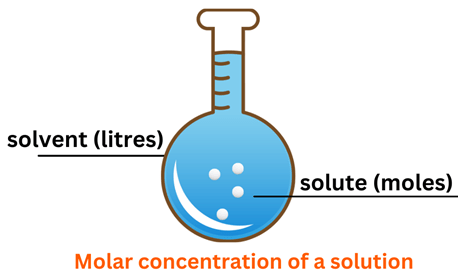
In chemistry, concentration is defined as the amount of a chemical substance dissolved in a specific amount of solvent. Different parameters can be used to measure the concentration of a chemical substance, such as molarity, molality, normality, weight/volume, volume/volume, etc.
Molarity is the most important one out of all the above-mentioned. Molarity or molar concentration refers to the moles of solute dissolved per liter of solution (Unit: mol/L or M).
A 1 M solution of a substance X in water is more concentrated than its 0.1 M aqueous solution.
If the amount of solvent is increased or the amount of solute is decreased, keeping a solvent constant, then the solution gets less concentrated or more dilute and vice versa.
What is absorbance?
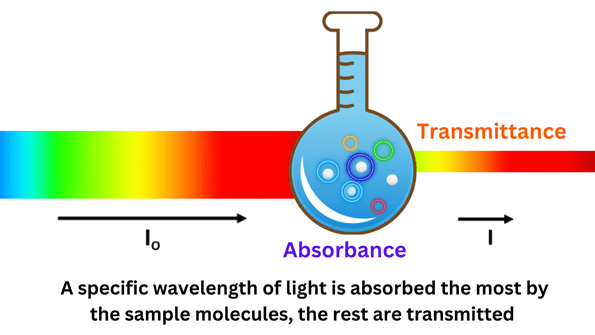
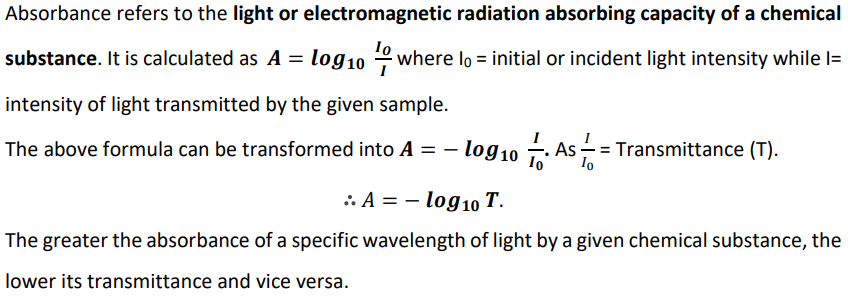
Absorbance, in simple words, refers to the light-absorbing capacity of a chemical substance. In this case, light is typically referred to as the ultraviolet and/or visible radiations of the electromagnetic spectrum having wavelengths in the range of 200-800 nm.
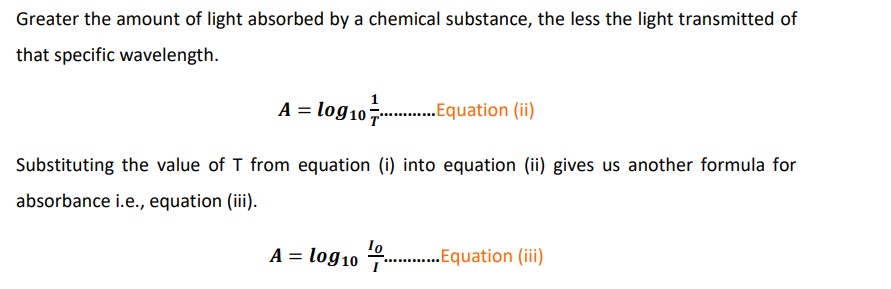
Different chemical substances absorb different wavelengths of light based on the chemical functional groups present in them. A specific wavelength of light will be absorbed by a substance X while all the others transmitted.
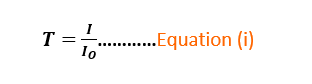
Transmittance is measured as per the formula given in equation (i).
Where
T = transmittance
I = intensity of light transmitted or reflected back
I0 = initial light intensity
Absorbance (A) is inversely proportional to transmittance. It is calculated by taking the positive logarithm to the base 10 of the reciprocal of transmittance (T), as shown in equation (ii).
Absorbance is a unit less quantity as it is calculated by taking the ratio of two light intensities.
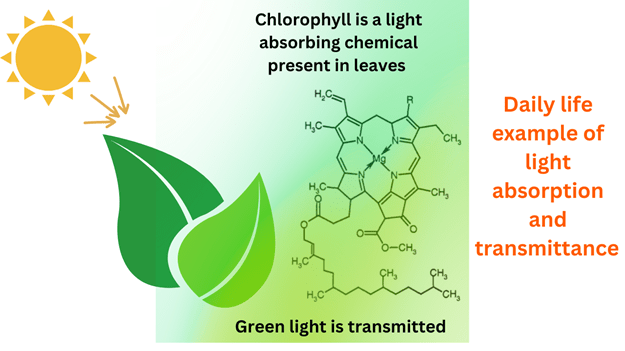
You can find diverse examples of light absorbance in our daily lives. Plant leaves appear green because chlorophyll is a chemical compound present in leaves that absorbs sunlight.
Chlorophyll absorbs (450-475) nm i.e., blue light, and (650-675) nm i.e., red light. So the complementary color of the color absorbed is transmitted i.e., green color (495-570) nm thus, leaves appear green.
You may also note that chlorophyll absorbs light due to the conjugation present in it. Conjugation refers to the linkage between two or more π-bonded systems in a molecule.
Functional groups such as phenyl rings that contain π-bonded electrons help chemical compounds absorb light by undergoing electronic transitions. The greater the conjugation present in a molecule, the higher its light-absorbing capacity i.e., absorbance.
Intensely conjugated compounds can undergo electronic transitions by absorbing low frequency i.e., high wavelengths of light such as visible light.
This concept is most widely applied to determine the concentration of a compound via UV-Vis spectrophotometry.
What is the relationship between concentration and absorbance?
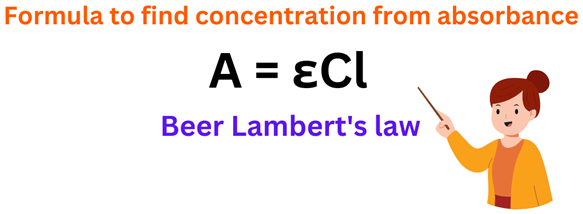
Concentration is directly related to absorbance, as per Beer Lambert’s law shown in equation (iv).
A = εCl……….Equation (iv)
Where
A = absorbance
ε = molar extinction coefficient, also known as molar absorptivity in L. mol-1cm-1 or M-1.cm-1.
C= concentration in mol/L or M
l = path length in cm
If the values of A, ε, and l are given, we can directly find the concentration (C) of a substance by applying equation (iv).
However, that is usually not the case in a chemistry laboratory. So what is it? Let’s find out in the next section.
How to find concentration from absorbance?
In lab practices, Beer Lambert’s law is applied to find the unknown concentration (x) of a substance X in a sample M via UV-Vis spectrophotometry.
General procedure for finding concentration from absorbance via UV-VIS spectrophotometry
Sample M is dissolved in a specific solvent that completely solubilizes X while all the interfering compounds stay undissolved.
A standard solution (S) is also prepared in the same solvent using pure compound X.
Different dilutions (X1, X2, X3, X4 and X5) of S are prepared.
A specific wavelength (λmax) is determined by performing UV-Vis spectroscopy on the least concentrated solution i.e., X1, in a certain wavelength range.
λmax is the wavelength at which substance X shows maximum absorbance even in its least concentrated solution. Thus, the absorbance of all five solutions (X1 to X5) is then determined at this λmax.
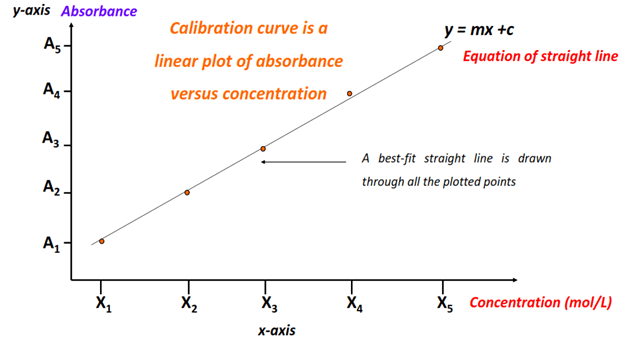
A calibration curve is obtained by plotting absorbance (A) versus concentration (X).
A straight line graph is obtained as shown below.
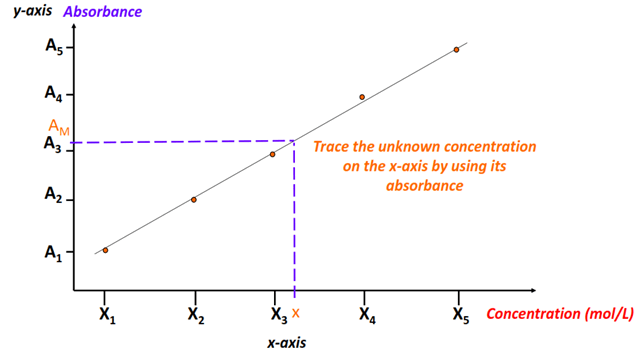
The absorbance of the given sample solution (M) is also noted down at λmax. Let’s call it AM.
The unknown concentration x is then determined from absorbance using the straight-line calibration curve, as shown below.
You may note that the equation of a straight line is y = mx + c. If absorbance is plotted on the y-axis against concentration on the x-axis, then gradient (m) of the straight line = εl while c = y-intercept = value of absorbance when x = 0.
ε stays constant for a particular sample as it measures how strongly a chemical absorbs light. It is based upon the functional groups i.e., conjugation present in the molecules.
The path length (l) stands for the distance light travels to reach the sample. In spectrophotometry, the path length is kept constant by using a sample cuvette of a fixed diameter, usually 1 cm.
Thus, C is primarily dependent upon absorbance and vice versa. The greater the concentration of the light-absorbing species in a sample, the higher will be the recorded absorbance.
Below are some solved examples which will help you understand all the concepts discussed in this article better, and above all, you will be able to find concentration from absorbance in different situations.
Solved examples for finding concentration from absorbance
Example # 1: As per spectrophotometric data, the absorbance (A) of the sample is found to be 0.70 at λmax = 275 nm. What is its concentration?
Diameter of the cuvette = 1 cm. Molar absorptivity of the sample = 8400 M-1 cm-1.
The following data is provided in the question statement:
⇒ Cuvette diameter = path length (l) = 1cm.
⇒ Molar absorptivity (ε) = 8400 M-1cm-1.
⇒ Absorbance (A) = 0.70.
So we can easily apply Beer Lambert’s law (equation iv) to find the unknown concentration C.
A = εCl……….Equation (iv)
Substituting all the given data and making C the subject of the formula:
∴ (0.70) = (8400) (C) (1)
∴ C = 0.70/8400 = 8.33 x 10⁻⁵ M.
Result: The unknown concentration of the sample is 8.33 x 10⁻⁵ M.
Example # 2: A food dye has a molar absorptivity of 25,900 L mol-1cm-1 at a wavelength of 501 nm. A chemist placed 1 mL of the food dye solution in a cuvette of width 1 cm. He recorded an absorbance of 0.17. What is the concentration of the solution?
The following data is provided in the question statement:
⇒ Cuvette width = path length (l) = 1cm.
⇒ Molar absorptivity (ε) = 25,900 L.mol-1cm-1.
⇒ Absorbance (A) = 0.17.
So we can easily apply Beer Lambert’s law (equation iv) to find the unknown concentration C.
A = εCl……….Equation (iv)
Substituting all the given data and making C the subject of the formula:
∴ (0.17) = (25,900) (C) (1)
C = 0.17/25900 = 6.56 x 10⁻⁶ M.
Result: The concentration of the food dye solution used in this example is 6.56 x 10⁻⁶ mol/L.
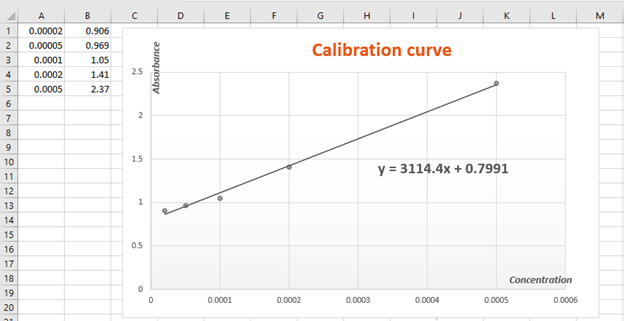
Example # 3: Different dilutions of a stock solution of pure substance X are prepared in water. The absorbance for each dilution is recorded at λmax = 690 nm and tabulated, as shown below.
Use the above-given data to find the unknown concentration (x) of an aqueous sample containing X whose absorbance A = 1.02 at λmax = 690 nm.
As a first step, we need to plot the given data either manually or using Ms. Excel by keeping concentration on the x-axis while absorbance (A) is taken on the y-axis.
For plotting the data in Ms. Excel, use the following simple steps:
Enter the x-axis and y-axis data in two adjacent columns.
Select both columns at once, go to the insert option at the top menu bar, and plot a line and scatter plot.
Right-click on the graph and add a trend line. Also, select the sub-option i.e., display equation on the chart.
Use the equation of the straight line obtained to find the unknown value of x by inserting the given value of y.
The straight-line equation obtained in this case is y = 3114.4 x + 0.7991. The value of y (absorbance) is given in the question statement i.e., y = 1.02.
So let’s substitute this value into the straight-line equation and find the unknown concentration (x).
∴ 1.02 = 3114.4 (x) + 0.7991
Make x the subject of the formula
∴ 3114.4 (x) = 1.02 – 0.7991
∴ 3114.4 (x) = 0.2209
x = 0.2209/3114.4 = 7.09 x 10⁻⁵.
Result: The concentration of substance X in the given sample is 7.09 x 10⁻⁵ mol/L.
The concentration of a solution refers to the amount of solute dissolved in a specific amount of solution.
If the solute is determined in moles while the volume is in liters, then it is known as molar concentration. 1 M solution refers to 1 mole of solute dissolved per liter of solution.
What is absorbance?
What is the relationship between concentration and absorbance?
The concentration of a solution is directly related to its absorbance as per Beer Lambert’s law, as shown below.
A = εCl
Where
A = absorbance
ε = molar extinction coefficient, also known as molar absorptivity in M-1cm-1.
C= concentration in mol/L or M
l = distance traveled by the light wave to reach the sample i.e., path length in cm
How to find an unknown concentration from absorbance?
The unknown concentration of a sample solution can be determined from its given absorbance by applying Beer Lambert’s law.
A = εCl
Making concentration (C) the subject of the formula, the above equation transforms into:
The values of ε and l usually stay constant for a particular solution under specific spectrophotometric conditions. If the value of A is given so we can easily substitute all the known data into the above formula and find unknown x.
How to find molar concentration from absorbance?
Molar concentration refers to the concentration obtained in mol/L or M. If the value of molar absorptivity (ε) is given in M-1 cm-1 while the path length (l) is in cm, then the concentration (C) will automatically be determined in M i.e., molar concentration using the Beer Lambert’s law:
In terms of units;
C =
As absorbance (A) is a unit less quantity, so we used the harmless integer 1 in place of it.
cm-1 cancels with cm while M-1 goes from denominator to numerator and changes to M.
∴ C = M= molar concentration.
How to find absorbance from concentration?
The absorbance (A) of a solution whose concentration is known can be easily determined by directly applying Beer Lambert’s law and substituting the known values of C, ε, and l.
A = εCl……….Beer Lambert’s law
Is wavelength an important factor in finding concentration from absorbance and molar absorptivity?
Wavelength (λ) is not directly a part of Beer Lambert’s law (A= εCl) which is used to find concentration (C) from absorbance (A) using molar absorptivity (ε).
However, A itself varies with the wavelength of light irradiated on a sample. The greater the wavelength, the lower the frequency or energy of irradiated light thus, less light absorption occurs and vice versa.
Specific chemical samples more strongly absorb a specific wavelength than all the others irradiated depending upon their functional groups.
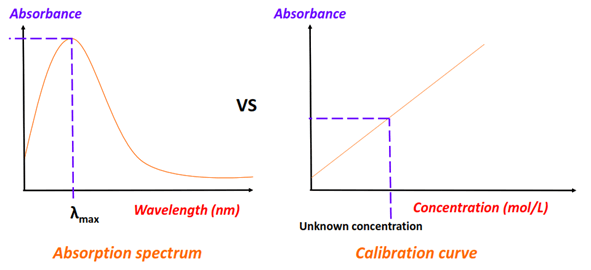
What is the difference between the absorbance spectrum and the calibration curve?
The absorbance spectrum is a parabolic curve obtained by plotting the absorbance of a chemical solution recorded against different wavelengths.
In an absorbance spectrum, absorbance is the dependent variable, while wavelength is the independent variable. A change in wavelength changes the absorbance of the solution while its concentration is kept concentration.
In contrast, the calibration curve is a straight-linegraph obtained by plotting absorbance (independent variable) versus concentration (dependent variable).
The absorbance spectrum is used to find λmax while the calibration curve is used to find concentration against a specific absorbance keeping λmax constant.
Summary
Molar concentration is the moles of solute dissolved per liter of solution (mol/L).
Absorbance refers to the capacity of a chemical substance to absorb electromagnetic radiation of a specific wavelength.
Specific chemical compounds absorb maximally at a specific wavelength known as λmax.
The greater the intensity of light absorbed of a certain wavelength, the lower its transmittance.
Absorbance (A) is related to transmittance (T) via an inverse relation.
Absorbance is directly related to the concentration (C) of a chemical substance as per Beer Lambert’s law A = εCl where ε = molar absorptivity and l = pathlength.
An unknown concentration (x) can be determined using Beer Lambert’s law if all the other values are known.
The unknown concentration can also be determined spectrophotometrically by plotting a straight-line calibration curve keeping A on the y-axis against C taken on the x-axis.
The unknown value of x can then be determined by tracing y to x on the graph manually or by substituting x into the straight line equation (y= mx +c) obtained in the Ms. Excel plot.
References
Edinstruments. (2019, October 17). The Beer-Lambert Law. Retrieved from https://www.edinst.com/blog/the-beer-lambert-law/
Schoolworkhelper. (n.d.). Beer’s Law Lab Explained: Absorbance vs. Concentration. Retrieved from https://schoolworkhelper.net/beers-law-lab-explained-absorbance-vs-concentration/
Ammara Waheed is a highly qualified and experienced chemist, whose passion for Chemistry is evident in her writing. With a Bachelor of Science (Hons.) and Master of Philosophy (M. Phil) in Physical and Analytical Chemistry from Government College University (GCU) Lahore, Pakistan, with a hands-on laboratory experience in the Pakistan Council of Scientific and Industrial Research (PCSIR), Ammara has a solid educational foundation in her field. She comes from a distinguished research background and she documents her research endeavors for reputable journals such as Wiley and Elsevier. Her deep knowledge and expertise in the field of Chemistry make her a trusted and reliable authority in her profession. Let's connect - https://www.researchgate.net/profile/Ammara-Waheed
Topblogtenz is a website dedicated to providing informative and engaging content related to the field of chemistry and science. We aim to make complex subjects, like chemistry, approachable and enjoyable for everyone.


, Examples")
")
, Relation, Examples")
, Relation, Examples")


, examples")
, examples")